Facebook offers a great opportunity to Facebook page managers to see statistics relative to the public activity on their timeline and also daily activity on their business page, via what is called as Facebook Insights. In order for businesses to get the most out of Facebook as a promotional aid, it is important to see if it is having the expected results. Facebook statistics allow you to analyze the number of ‘likes’ and ‘sharings’ you get, so you can see if your Facebook activity is doing well or if your web image is in need of improvement or change of strategy.
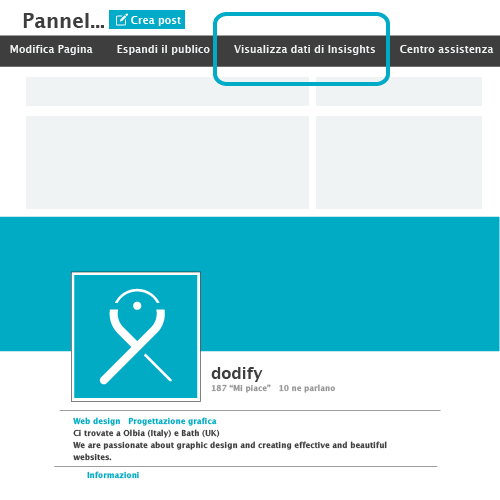
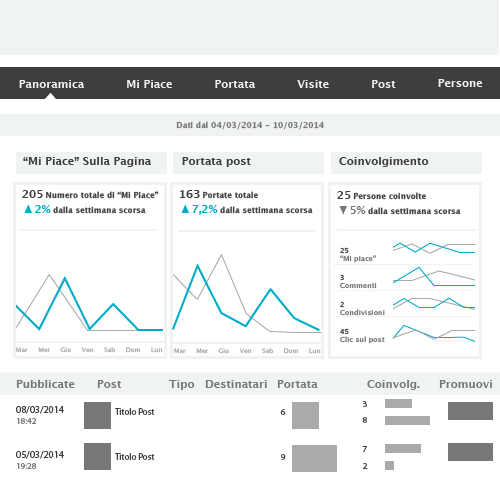
In the previous post we showed you how to start actively managing your business page, now we will give you some advice on how to read the data created by insights. The most important aspect is not to just focus on the negative or positive statistics, but to try to analyze why some posts have been more successful than others, and this can perhaps be due to: Time of publication? Diversity of audience? Holidays? If you go on your page and click on “See Insights”, Facebook will first of all show you data relative to the week in progress, and if you have more or less activity with respect to the previous week. It will also show you how much interest your posts generate.
In order to get more details go to the other five sections: Like, Reach, Visits, Posts, People.
Likes
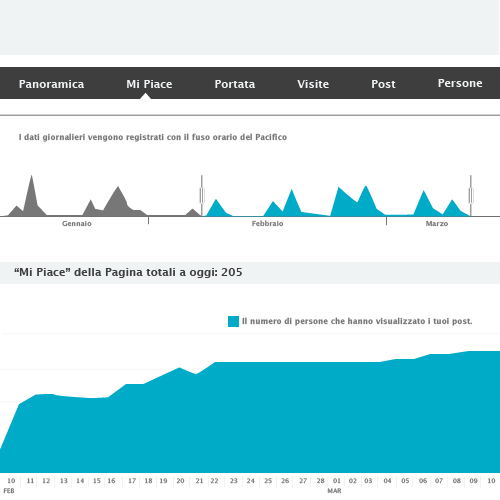
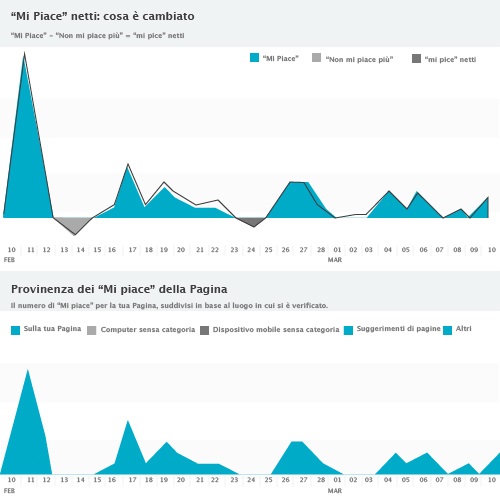
Facebook here will show you the total number of likes you received on your page, and if you are a good manager, you should have always had a constant increase since you started your page, and if you are real professional you should have seen a substantial growth in numbers over a long period of time. Facebook will let you see how many Likes you get daily so you can easily see which individual actions result in an increased activity by your fans. You can also find statistics on people that “unliked” your page and hence the number of fans that are abandoning your page.
You can also see where the “Likes” come from, for example:
- "On Your Page", that is from you own page directly;
- “Page Suggestions”: Facebook has suggested the page to users;
- “Uncategorized Mobile”, mobile traffic is increasing so don’t underestimate this effect when posts are shared*;
- Other people’s posts;
- Other;
Concluding this first page will already help to answer some questions: Who is my public? What do they like? What topics interest them?
*On average Italians possess more than 3 mobile devices each (3.3 to be exact). By 2017, there will be 10 million devices, each will be able to connect to a mobile network (Cisco). Central and Western Europe: mobile traffic data has had 66% growth annually (the volume of traffic in 2017 will be 12, 8 times more than that in 2012).
Reach
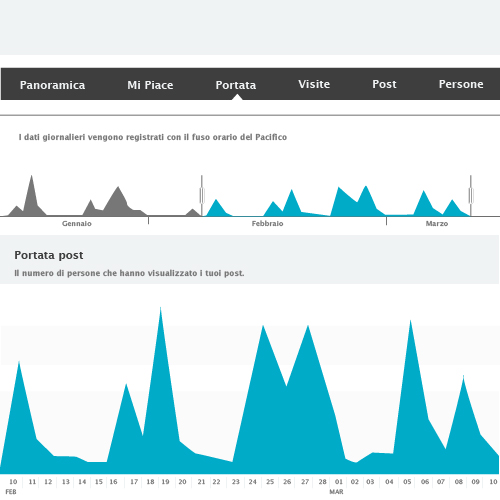
It is important to study the reach of your posts: it indicates which topics are interesting to your public and are getting shared. Facebook shows the number of spontaneous interactions a day and the eventual number of paid interactions with your sponsors, if you have paid for them. We will not take into consideration this aspect. Yet another graph shows the number of Likes, Comments, and Shares. Usually these three activities go hand in hand: interesting posts are shared and commented on and unfortunately not always the way you want! Some articles and items may not reflect your interests. Depending on what is posted, some users may not only unlike your page, but they may even labelled it as spam if it is thought to be offensive or inappropriate, so be careful.
If you do not use Facebook at the weekend but your weekly activity is constant and appreciated by your fans, your page activity will reflect this. This is a good signal that indicates that your audience is interested in your content.
Visits
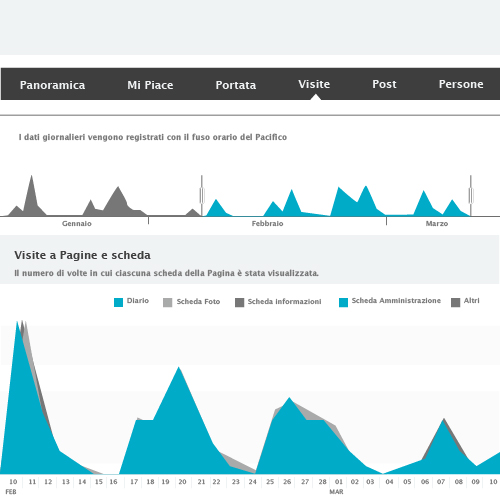
Here Facebook shows the data relative to the number of times each tab of the page has been seen. If your fans want more details about you and your activity, from the posts you have shared, they can click through and go to see your page information, your photos, events etc. which is contained in the other page tabs. Facebook will also show data relative to visits to your timeline, admin tab, photos and any other content.
Therefore, it is always important to regularly check your tabs to keep them well organized and updated, especially the photos. Remember to reorganize photos and other images on Facebook along with other activity on your page like posts. In the graph "External Referrers" you can find out where visits came from: Google, Your site or any other site from where your link may have been posted. Google of course is usually one of the main sources of incomming traffic.
Posts
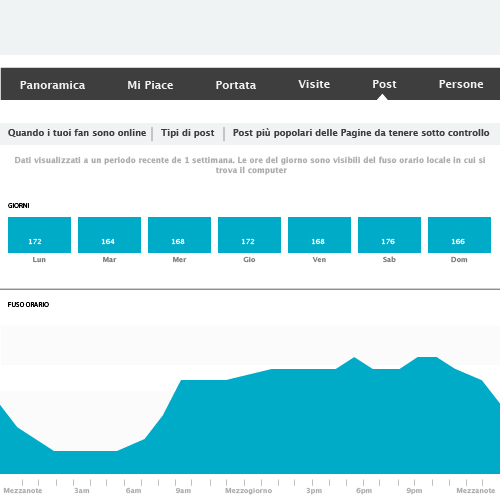
Here you can find the famous "whale" shaped graph which allows us to see when your fans are online: usually from 13.00 to 19.00 and clearly not at night: the whale varies in form from one day to another, as long as you don't manage the page of a disco, the moment of least use is on a Saturday night.
Here you can also see data relative to every single post:
- Reach, the number of people who have seen the specific post (this increases with the number of shares);
- Participation (clicks, likes, shares, comments). The number of clicks is important because it indicates how interested your fans are and how much they wanted to go into more depth about your topic;
By clicking on the posts you will get details on the content/posted link: number of users who have received the post, likes, comments and sharing, number of clicks and negative comments. Also remember that data from Facebook can be downloaded by going on “Export data”.
If you are not happy with your results and think that your "content marketing" on Facebook is not enough to promote your page, then you can publicize your page using Facebook itself at a cost. Of course this cannot be considered as real social media marketing.
If you have any questions please do no hesitate to contact our team.
Share this article